Amazon has been rolling out new AI-powered upgrades, and one of the most practical additions is the Rufus price history feature. It doesn’t try to be flashy — it just gives you the one thing every shopper wants: clarity.
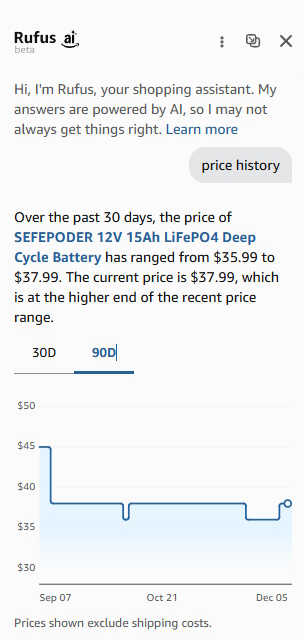
When you ask Rufus for a product’s price history, it instantly shows a 30-day and 90-day trend, complete with a clean chart and a short summary.
No digging through camel-camel-camel, Keepa, Helium10 or other browser extensions, no manual tracking. The information appears right inside your Amazon app or browser sidebar.
For example, if you’re looking at a car battery, Rufus will tell you something like:
“Over the past 30 days, the price has ranged from $35.99 to $37.99. The current price is at the higher end of the range.”
It also visualises the trend so you can see if the price has spiked, dipped, or stayed flat. That’s all you really need to decide whether to buy now, keep an eye on it or shop elsewhere.
Why This Matters
Amazon pricing changes constantly — sometimes multiple times a day. Having Rufus summarise that movement helps you:
-
- Avoid overpaying during temporary price spikes
-
- Spot opportunities when an item drops to the lower end of its range
-
- Make smarter, faster buying decisions without leaving Amazon
It’s a simple feature, but for frequent Amazon users it’s one of the most useful. AI doesn’t need to reinvent shopping — sometimes it just needs to tell you whether the price is good.
What It Means For Sellers
I’ve been advising sellers for years to try and keep price as stable as possible. A price hike almost always leads to a drop in rankings. This is another reminder not to constantly tweak prices — Rufus makes every fluctuation visible to shoppers, and erratic pricing can erode trust, hurt conversion, and make a product look unstable compared to competitors.